GREEN100® Index 2023 (Edition 2)
World’s Leading Organization Innovating for Our Green Future
The State of Quality Patents in GREENTECH
Key Findings
GREEN100® Organization Contribute
- 19.20% of the Green Patent Portfolio globally in the assessment year
- 38.40% of the High-Quality Green Patent Portfolio
GREEN100® Headquarters
- 31 organizations belong to USA
- 23 organizations belong to Japan
GREEN100® Average Geographical Spread
- Combined Average Geographical Spread of the GREEN100® Organizations is 2.17 which means that on average each patent filed by organizations included in the GREEN100® is published on average in about 2 countries.
- Only 16 organizations featuring in the top 100 have Average Geographical Spread greater than 3.
- DEXCOM INC, BBK Electronic Corp, Corning Inc and JOHNSON & JOHNSON are the companies with Average Geographical Spread more than 4.
Green Patent Origins & Impact
GREEN100® Patent Origins
- The first patent application filed by the GREEN100® Organizations are observed to be limited to the 43 unique countries with top countries being Japan (28.24%), China (26.58%) and USA (17.52%).
- China has witnessed significant increase in the patenting activity among top 100 organizations. It has increased its share by more than 300% in the current assessment period.
- United states while ranked 3rd in the Edition 2 Ranking in terms of number of Green patents filed, however, 23.86% of the high-quality patents are originated from USA. China accounts for 17.28% of high-quality patents followed by Korea which has 15.75% share.
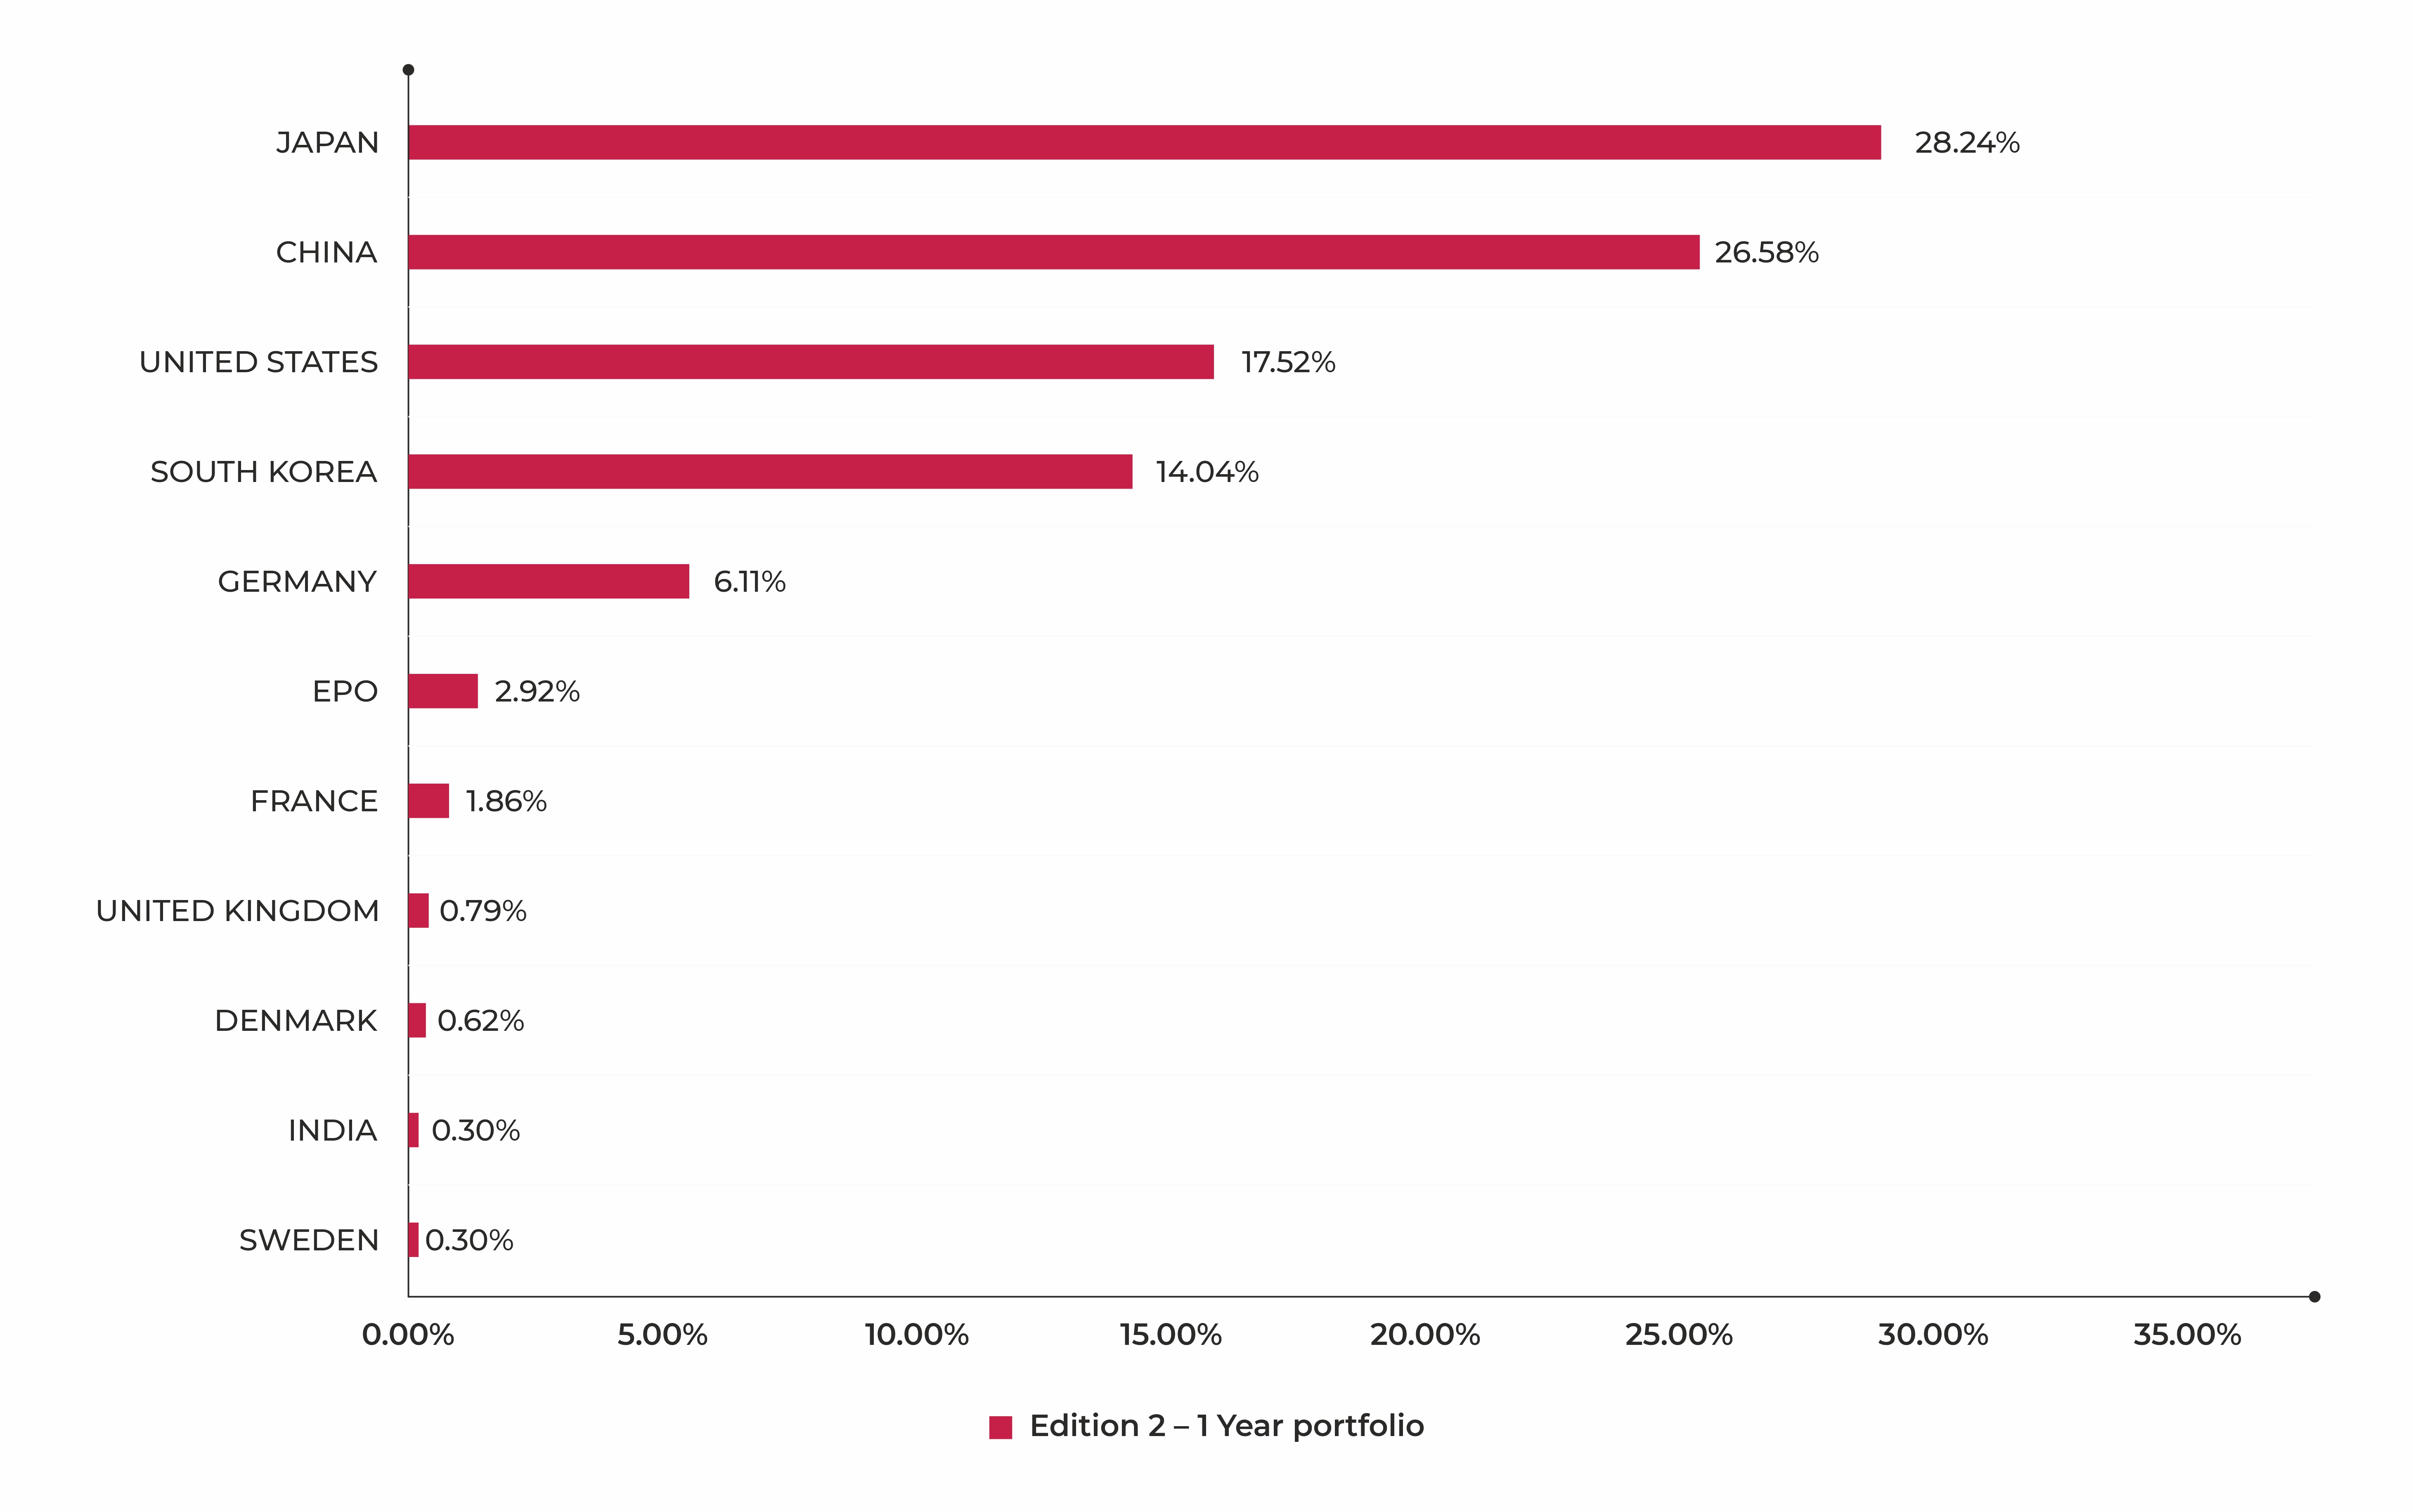
*The first filing countries (priority countries) of the GREEN100® Patent Portfolio have been considered to generate the above illustration. The illustration highlights percentage distribution of patent families among research countries.
GREEN100® Impact Areas
- When considering the industries impacted by GREEN100® Organizations, Energy and Power witnesses highest patenting activity. Patenting activity in Industrial Machinery and Metal processing show an increase compared to patenting activity of the ranked organizations in Edition 1 findings.
- Transportation – Motor Vehicles and Parts is the next most targeted industry with 16.48% share and similar to the Edition 2 study, is the 2nd largest industry in terms of overall patent filing.
- Waste management is one of the biggest impact areas if we consider the entire, Green Patent portfolio, however, top 100 organizations contribute just 1.22% innovation share in this area.
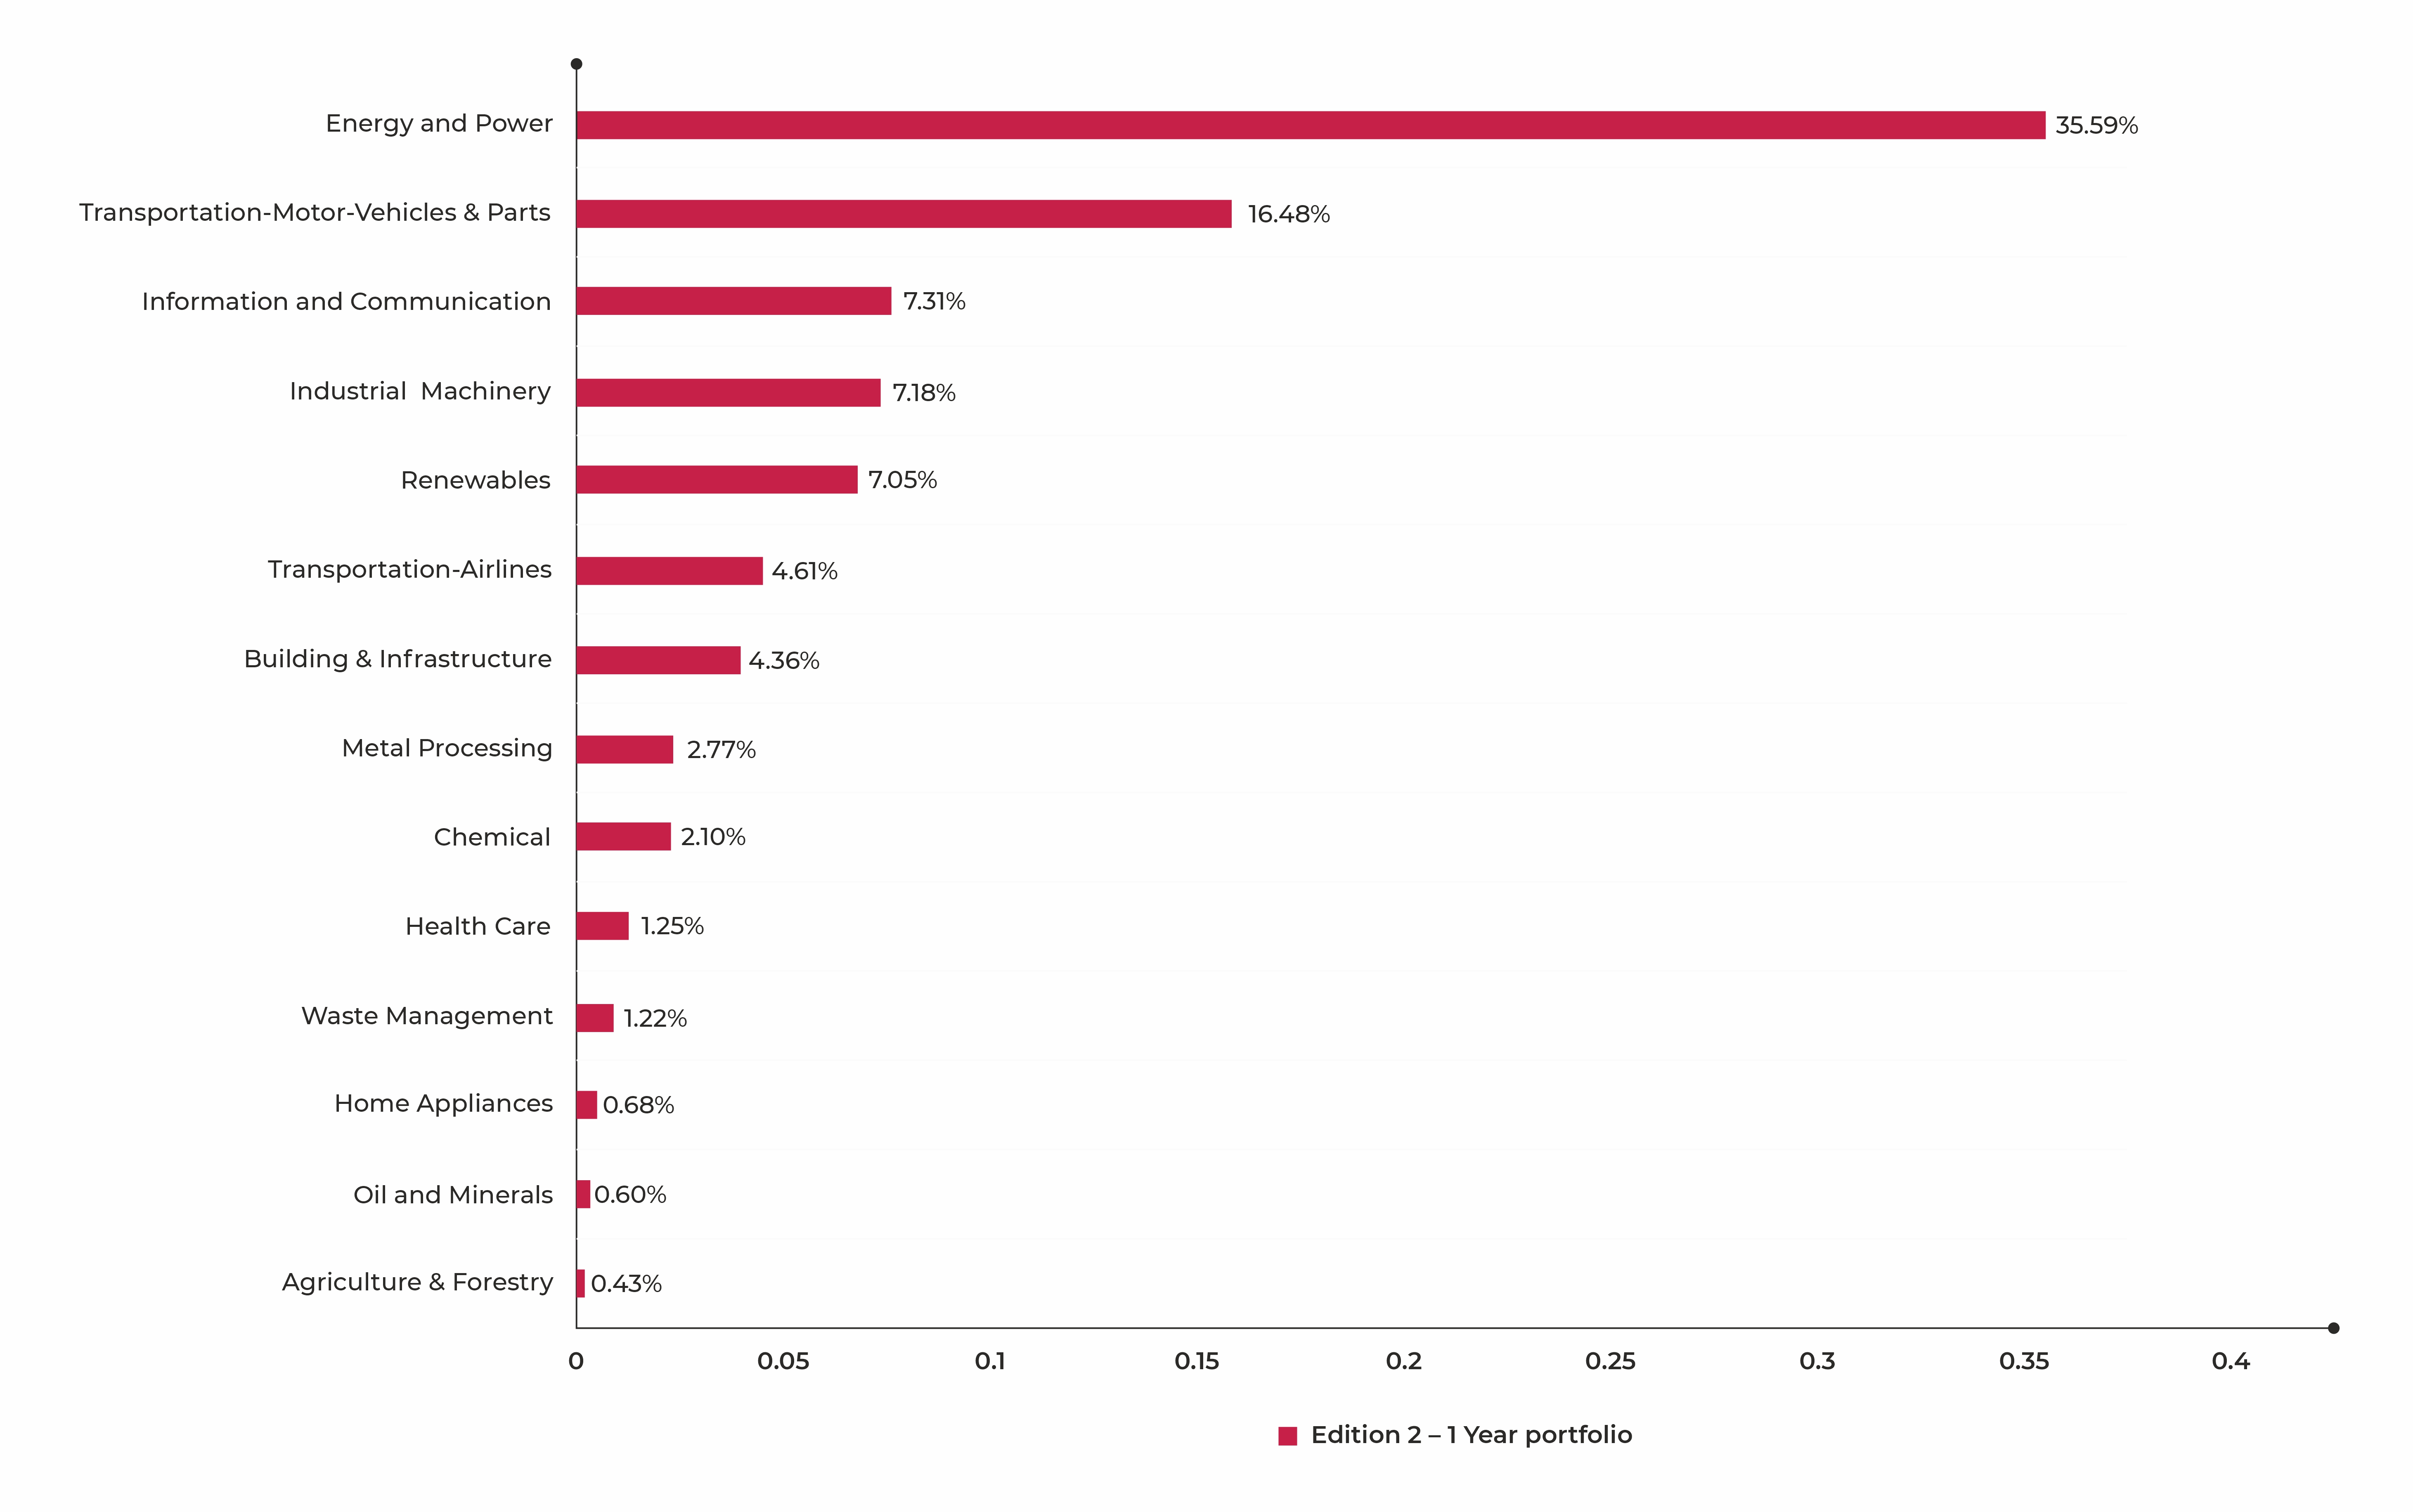
*The Y02+ and Y04S+ sub-classifications of GREEN100® Patent Portfolio have been studied to define the industry nomenclature and derive the above insights. The illustration highlights the percentage distribution of patent families among various industry areas.
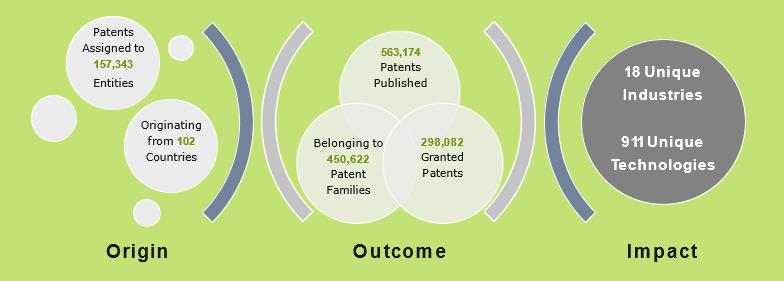
Data Coverage
(November 2020 - October 2021)
- Over 563 thousand patents published
- Belonging to 450 thousand Patent Families
- Owned by 157,343 entities
- Originating from 102 countries
- Impacting 18 unique industries
Quality Vs Quantity
Quality Innovation for a Green Future
- Quality innovation in the domain of Green Technologies is imperative for creating a Green Future. For instance, 40 organizations which feature in the top 100 based on their Absolute Green Patent Portfolio size did not eventually find place in the top 100 as the ranking considers Quality of patents along with Quantity.
- Companies like DEXCOM INC, TESLA NP, AT&T INC and BLACKBERRY LTD have less than 100 patents in their Green Patent Portfolio.
Assessment Framework
All the organizations with share in Green Patent Portfolio, have been evaluated using an assessment framework that relies on multiple parameters indicative of three key components using the Sagacious Patent Portfolio Quality Mix (SPPQM) Methodology. These components are,
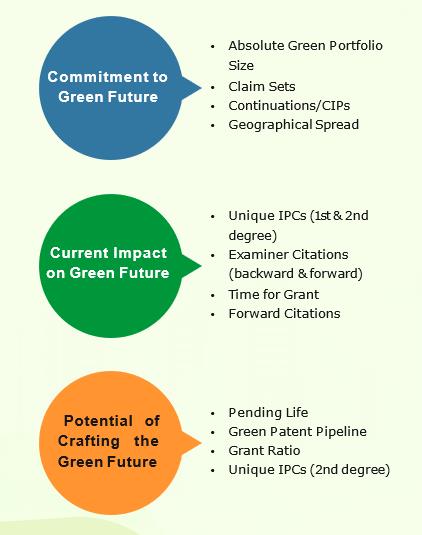
Commitment to Green
Future
Assesses the commitment each organization is exhibiting for the Green future. The commitment is assessed based on investment they have made in research as depicted by their IP filings (Absolute Green Portfolio Size, Geographical Spread etc).
Current Impact on Green Future
Measures the current impact, they are likely to have created towards a Green future. This impact is adjudged broadly though the overall quality of their individual Green Patent Portfolio as well as number of industries/ players impacted through their patented research.
Potential of Crafting the Green Future
Determines if an organization is consistently contributing to the Green Future with a patent pipeline to lead the Green future. This is evaluated based on their Green Patent Pipeline, future potential to exclude as well as future applicability of their patented research.
The GREEN100® Index Ranking is based on The Sagacious Patent Portfolio Quality Mix (SPPQM) methodology which has been refined and strengthened over the years at Sagacious. SPPQM has been used by various mid and large sized organizations to make strategic decisions such as portfolio pruning, benchmarking, licensing and/or acquisition etc. The SPPQM methodology offers flexibility to derive the outcome based on the nature of the project. For GREEN100® Index Ranking, 15 distinct objective parameters have been considered to evaluate the patent portfolio’s quality. The methodology is also validated through focused deliberations with Industry experts particularly to define the scope and computations applied to arrive at the rankings.
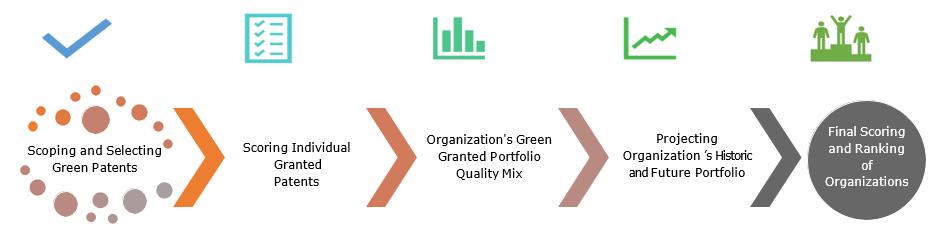
The process of Portfolio Quality Mix analysis involves following steps broadly:
- Scoping and Selecting Green Patents
- Scoring Individual Granted Patents
- Organization's Green Granted Portfolio Quality Mix
- Projecting Organization ’s Historic and Future Portfolio
- Final Scoring and Ranking of Organizations