“Sagacious SCALE™” – Webinar
Topic of the webinar: Sagacious SCALE™. How the intersection of Patent & Business Analytics can strengthen your investment and M&A decisions?
Table of Contents
Key-points to be covered in the webinar “Sagacious SCALE™” session
- Firstly, identify acquisition/merger targets that complement your technology needs;
- Further, search for a collaboration partner that will catapult your position in the market;
- Moreover, how to identify strategies so that you to remain ahead of your competition;
- Finally, look for future strategy while looking in terms of investment and execution.
Key-note Speaker
Nitin Sharma, Group Manager – Searching Engineering, Sagacious IP
Harsha Agarwal, Assistant Manager – Life Sciences, Sagacious IP
Anchor
Faiz Wahid, Regional Head – Europe (Sales), Sagacious IP
Submit Your Information to watch the Webinar Video:
"*" indicates required fields
Hello everyone, thanks for joining in today for this webinar on the Sagacious Scale.
Faiz Wahid: A unique, competitive benchmarking tool for taking timely investments, eminent decisions, and my name is Faiz Wahid and I’m the Regional Head for Europe at Sagacious IP. I’ll be your host for the webinar today.
I’m really delighted that all of us could come together for this session at this time and I’m really glad that you chose to spend your valuable time with us on this webinar.
Let me welcome you all for this session and go ahead and introduce our speakers for the day.
I have, with me, Mr. Nitin Sharma is a Manager in the Patent Searching Team, focused on the engineering vertical at Sagacious.
Nitin has an expertise in prior art searches landscape projects and freedom to operate searches. And is also has been working a lot on market research and competitive benchmarking, leveraging the intellectual property ,research data at Sagacious. So welcome to the webinar Nitin.
We’re also joined in this webinar today with Miss Harsha Agarwal is the Project Manager in the Life Sciences and her experience includes various forms of IP search around the Biotech and Biochem industry. Welcome, Harsha
So, you know, before we enter into this topic, Sagacious Scale, it’s an acronym, I believe. So I would invite Nitin share his initial thoughts on, on this particular topic, and what is the context of Sagacious scale. So Nitin, over to you.
Context of the Webinar
Nitin Sharma speaking Thank you so much and I would basically start by saying that today, organizations across the globe are realizing the importance of knowledge based economy, and they are investing heavily in intangible assets. So as we know that organizations have to type of assets, they are segregated into tangible assets and the intangible assets.
So I was recently listening to one of the lectures of Dr. Francis Gurry. He’s Director General of WIPO. He mentioned about the asset distribution of Standard and Poor’s 500 companies and basically it would do very good data point that from the 1970s, till they are 2010, that means in around 32 years, the share of intangible assets for these 500 companies has increased 16 times.
So that’s how we can see the direction is moving and it becomes very important that in case a company is taking any business decisions, then role of intangible assets should be carefully considered. So we have created a competitive benchmarking tool. Its name, as you mentioned, is Sagacious Scale.
It carefully considers the intangible assets and mainly patents. So I hope we would be able to explain the concept of scale in the upcoming slides. So that’s all from my side.
Faiz Wahid speaking Yeah, thanks, that then, I believe, I think the, you know, you mentioned about the back end. You being used as a, as a way of assessing competitive intelligence.
I think the role of intellectual property in assessing competition is, if not underplayed, at least is limited in terms of competitive intelligence and an understanding and I think this tool would really help organizations in including intellectual property as a way of assessing, you know, the competitive landscape for broader decision making within their businesses.
Let me ask her about her thoughts before we jump into the presentation. So, Harsha, what are your inputs before We start the presentation.
Harsha Agrawal speaking Yup. It’s like you and Nitin mentioned that they can influence these business decision decisions of mergers and acquisition, which are very critical for a business. And these are usually done based on competitive intelligence or pick a benchmark, and these competitive benchmarking is based on various financial data, marketing, strategy and various other parameters
The state of the art for the competitive benchmarking tools, right. Knowing the industry, also utilizes various aspects of these of these tangible assets like marketing strength or market share. But slowly decision makers are realizing that IP is a critical parameter. And that we would want to examine these decisions from an IP lens and IP perspective, and that is exactly what we are trying to do here. Augmenting these IP analysis leveraging being on the top providers of IP solutions worldwide. We are leveraging the expertise that we have, and augmenting it with market research analysis. And all of these are the various parameters to come up with a tool that will be a holistic picture of the competition.
Faiz Wahid speaking Wonderful, Wonderful, And I believe both of you representing different in different technology domains. You know, you got Harsha coming from the Life Sciences side, and then Nitin coming from the engineering side, I believe if you’re presenting on the same topic of scale, then that means that this is more of a technology independent solution, which can be applied by any, any different industries.
Nitin speaking Yeah, definitely faiz . That’s exactly what Sagacious Scale is and it’s technology independent.
Faiz Wahid speaking It can be used by other Technology/ industries?
Nitin speaking Yeah. Absolutely.
Faiz Wahid speaking Wonderful. So, thank you for setting the context of the webinar. Before we move ahead, and I invite harsha to start with the Presentation.
Let me just mention to our listeners that you should be able to share your questions during the course of the session, by using the Go to Webinar question box on the right side of your presentation window. And I will pick up on those questions, and ask them towards the end of their presentations. So, that would be the primary thing.
And towards the end, we also want to talk about the Sagacious Scale and some of the topics that the team is working on to produce reports. And there is a special offer for participants of this webinar who would like to participate in those reports. So I will talk about it at the end. Let us now get started with the main part of our presentation. And for that let me invite harsha to start with her slides largely focusing on the scale methodology. So Harsha over to you.
Role of IP in Business Decisions
Harsha speaking Thank you faiz. Thank you for that introduction. And first of all, before we move into how they perform scaling, what is exactly the methodology that we use? I would like to take this opportunity to talk a little bit more about our motivation, Right, As we just spoke in our initial remarks. So, basically, what competitive benchmarking allows any company to do is it allows them to know their case in the industry.
In terms of a competitive analysis, these tools that exist in the market, or other consulting services that provide the same solutions, they use various parameters of information related to marketing, product performance, and all of that and evaluate the market positioning and the competitive analysis of any company in any domain.
However, with moving times as we can see that intangible assets are becoming a part of business decisions and the overall economy and there importance in these decisions is also increased
Understanding the role of IP in these decisions We realized that actually, right now, the use of IP or patents, for that matter, specifically in business decisions is currently under exploited, In our opinion, like there could be a lot more that could be done with IP. None of tools that an existing right now in the market use that in an intersection of intellectual property data with other business data to evaluate competition and does what we’re trying to do is fill this gap and come up with a holistic approach for competitive benchmark.
So as I mentioned, there are various tools that you can offer competitive benchmarking that are currently utilized by companies and one of the most famous of popular ones that I would say would be Gartner’s Magic Quadrant, and I’m sure most of you would be familiar with Gartner’s Magic Quadrant. They did take any industry and divide the competition into four different grids and position the competition accordingly.
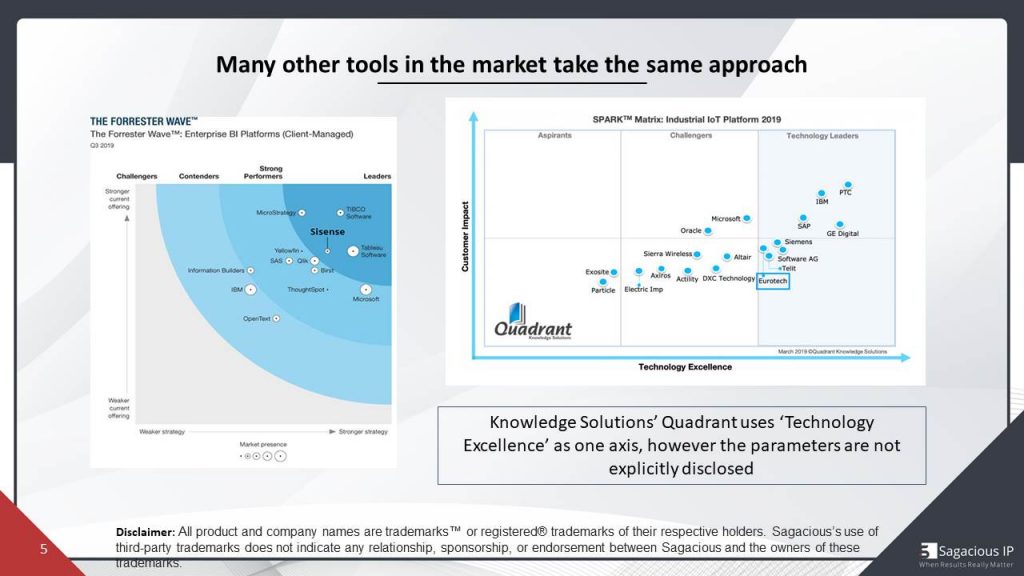
Tools like Gartner’s Magic Quadrant use are based on the vision, which is basically market strategy and the ability to, which is, again, marketing solution. What we see here is that what we’re talking about, the intangible assets that actually are not very prominently used. Similarly. There are many other tools in the market that take the same approach. And that’s, overall, we realize that IP will give the decision makers a new perspective on the competitive benchmarking.
Sagacious Scale: Introduction
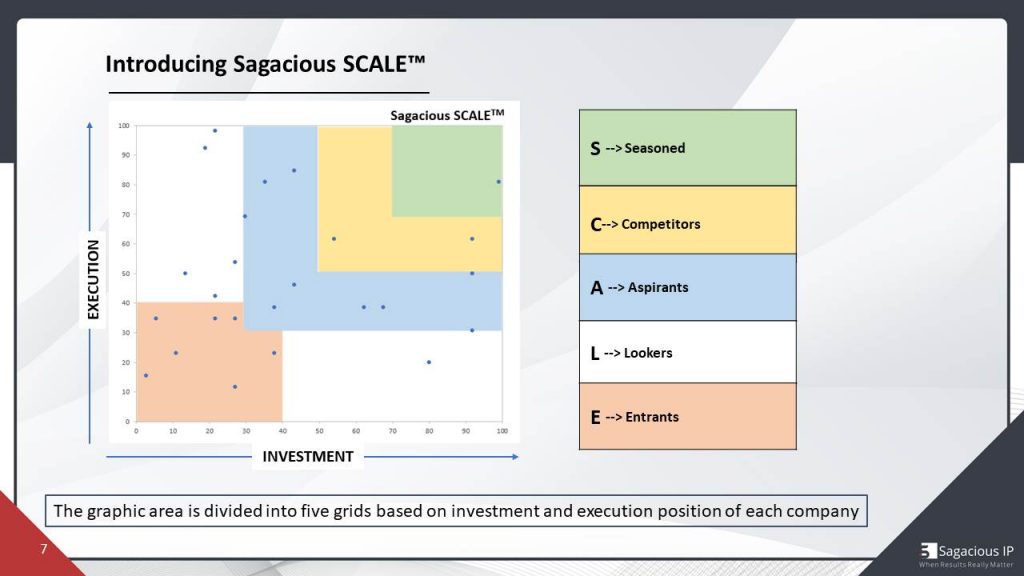
So then I would take the opportunity to introduce Sagacious scale. So, scale is a graphical analysis tool, which uses the same quadrant approach, and it divides the overall graphical area into five grades.
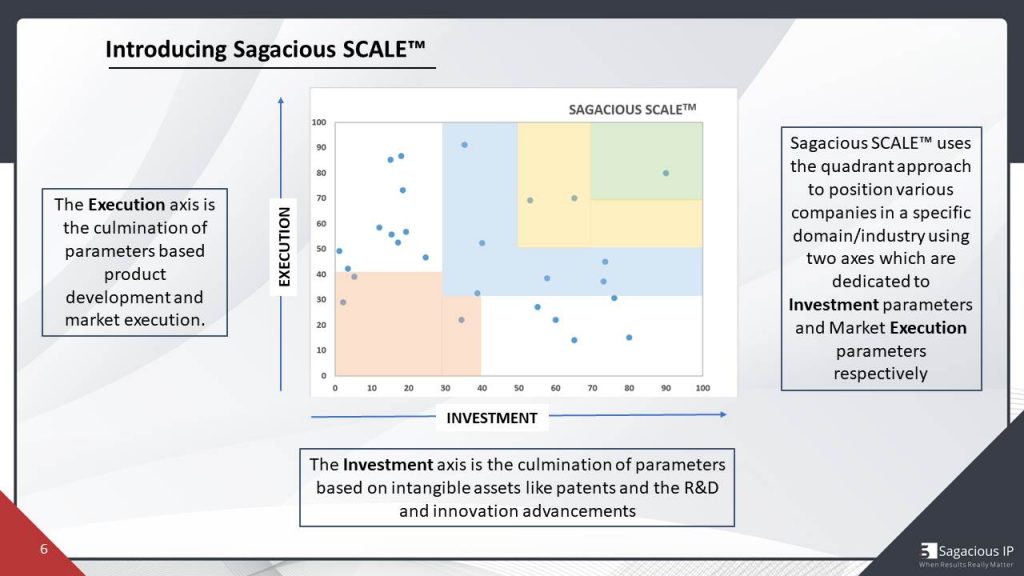
The two axes that we use for these big issues is the investment axis, Investment axis is basically the culmination of these families that are based on an intangible assets like patents and R&D and then we have the execution of axis, which would be, again, the market based data that other tools are also using and which has been explored. So what we have done is basically added the loss on the X axis, to include bad, ambiguous performers, which are based on intangible assets like patents.
To further deep dive into what the grids of Sagacious scale look like, so we have the first grid topmost which is the season players. That this would basically incorporate all those players that are top players. have high performing assets throughout.
Then, not very behind. We have competitors, which are very slightly, you know, maybe a behind the season players, but again performing extremely well on both the investment and the execution axis. Then we have Aspirants ,now these aspirants are Who changed the game?
So Aspirants can be companies which are performing extremely well on either of these axis or some of our company can have speeded R&D but not have actually market presence. And another company going to have an excellent market presence and not actually have a lot of R&D
Then we have what you would see as outliers, in any mathematical situation where these are outliers in terms of one axis, then this company would be doing extremely well on one axis and not really performing anything on the other one. Then we have entrants , or, as you’d like, or you could also call them Emerging Players which are companies which are, again, doing that event. But they’re not office out of a smaller scale, what that impact right now.
And when we see trends, we can talk about both small companies like startups, which are just entering the domain, also, an established company, like Amazon.
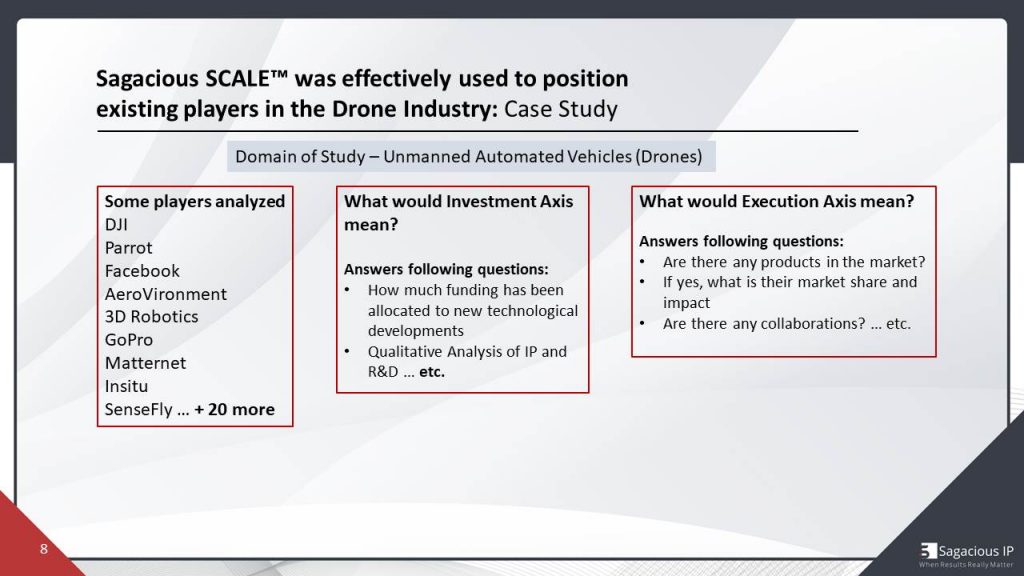
So, now, are taking this conversation ahead, and to understand more, a little bit more about what investment, and execution means, if you would like to take a case study, the case study that we’re using hereis that of the drone industry. So, that when we study, in that case an unmanned, automated vehicles.
The players that we analyzed multibillionaires, DJI , GoPro being, some of them. And all of these companies are positioned using our methodology on the sagacious scale, as you would see in the upcoming slides.
So if you just take the example of a drone industry. In a very layman’s perspective, what would investment axis mean in the sagacious scale? So the investment access would actually try to answer question, which we’ll talk about, what is the quality of the IP portfolio, what R&D the company’s doing. Any funding in the R&D, and aspects like that.
And when we talk about the execution, as the name suggests, it would be about whether that be is being executed at any products in the market, if it is their market share that the company is able to get to capture and so on.
So, continuing this, if we talk a little bit more examples and talk about the investment and execution axis only. Sagacious uses such parameters for each axis. So, the investment axis is a culmination of multiple parameters
Sagacious Scale : Methodology
So, say, for example, we have patent portfolio, these two companies, DJI and facebook, that we are comparing, and not only portfolio size, but, then, also, what is the impact of this portfolio in terms of how good the patents are. Then, you have diversity in portfolio that we talked about various technology aspect, that these portfolios captain and again, very important that there is an investment in R&D ,and if there is, how significant is the investment.
Similarly, for the execution axis, that would be culmination of parameters like market offerings, product development stage Either one would be complementary, technological aberrations, which we will again, explore more in the upcoming slides. if we analyze two companies on the execution that you would see say for example, in development stage DJI has this Score of 5 and Facebook has only 2.
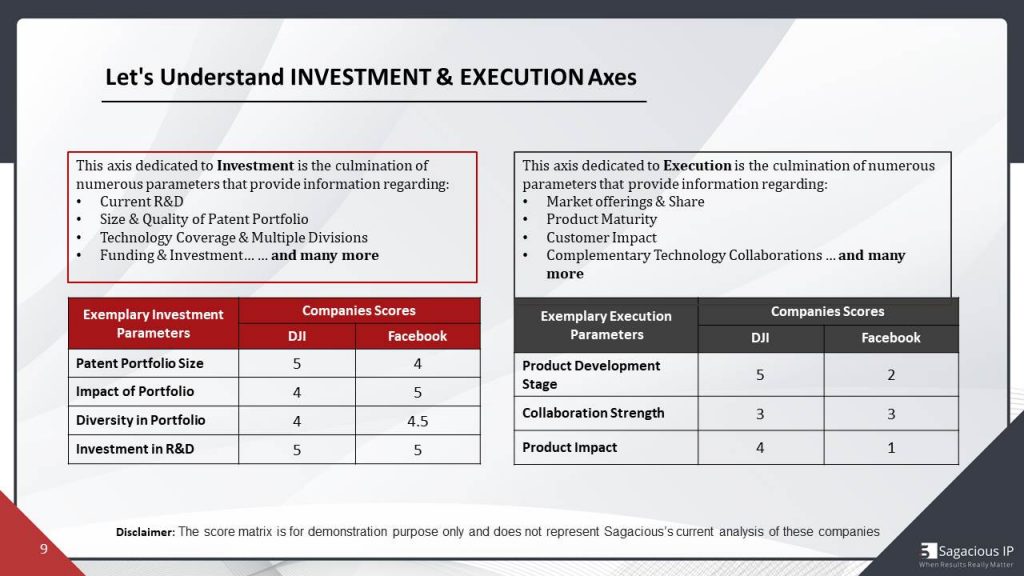
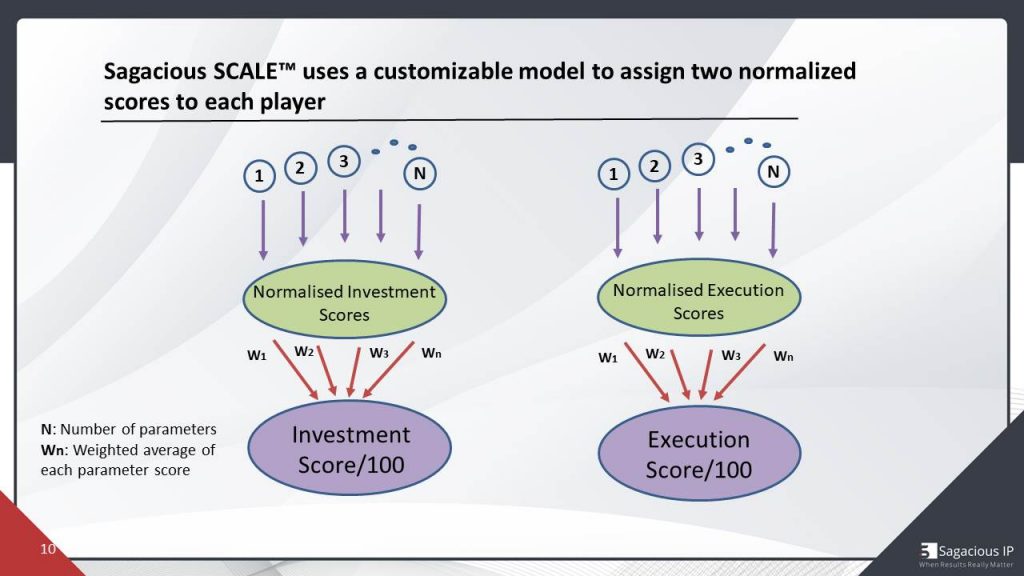
So as you can see that you know Facebook scores really value the investment access, but on the execution axis it was low. now we’ll see the impact of these scores as we move ahead. once we have these scores with us, as it has a customized model and using these parameters we assign, not to normalize was out of hundred each.
For example, say I have parameters in any industry. And I would, I say, I’ll give, like the analysts would be exposed to each and every parameter. And once these scores are normalized, and then we take weighted average of these parameters to give that company an investment score out of 100.Similarly, again, doing the same thing for execution. We would, again, do the same. Go through the process off of capturing and identifying the parameters, scoring the company on those parameters, normalizing the scores using a weighted average and given executions.
Once we have both the investment and the executions floor for a company, then we would use our Sagacious scale analysis and plot this on.So, as we saw in that previous slide, Facebook and DJI, and we saw what their scores look like, so, now, I’m sure you would be interested to know if those called like that, where would DJI and Facebook be placed on?
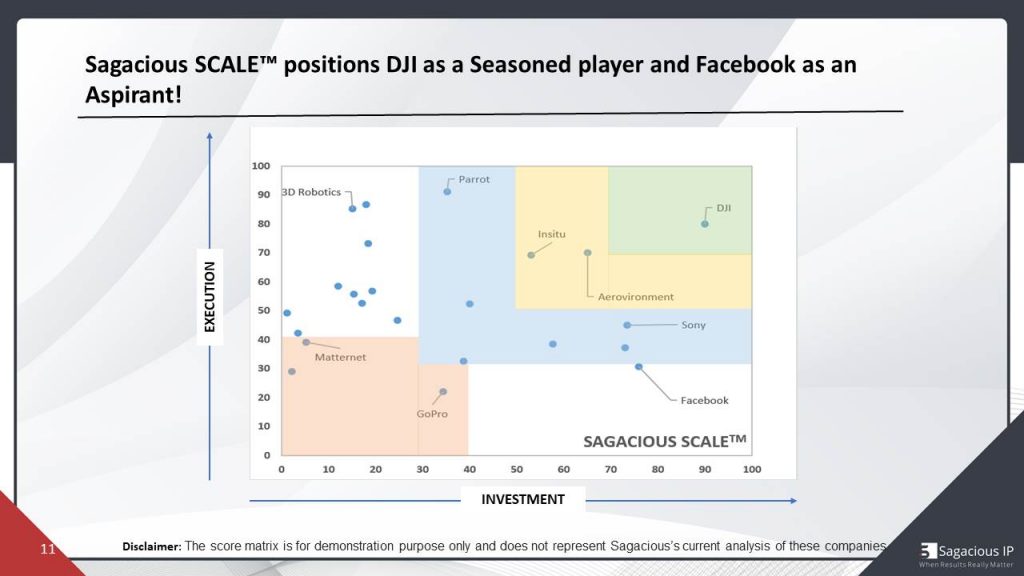
So there you go, As we see, as we expected, DJI performed really well on both of these axes and thus DJI is a season player, and I may talk about Facebook. I mentioned then that I think Facebook is doing really well on the investment grade but not good when it came to execution reliability.
So, this is how using various parameters on two different aspects, we used, we are able to, position various companies using sagacious scale. And this is the methodologies site from my end, and I would ask Nitin to take over from here.
Over to you and then faiz, thank you.
Faiz Wahid speaking Yep, thanks such. Thanks for explaining that. The methodology part, I think there are some questions flowing, and so I will touch on those questions later on. But yeah, I think, now that we know that, OK, this is the way, a scale, you know, matrix could be produced, and I believe you didn’t mention it, probably you assumed that the scale is, for a particular domain, or a particular technology area.
So like when you talked about DJI and Facebook, you meant about DJI being a seasoned player, in the drone industry, in order unless unmanned vehicle space, and at Facebook being an aspirant in that space. while in other technology areas, or other domains, that organization, or that company might have, a seasoned status, but in this particular technology domain, they are not.
That’s really interesting, and that’s very unique because you can look at players from a very narrow point of view and know where they stand within that industry. So thanks for sharing that. let me call now, Nitin to present his set of slides, which I believe are around how do we actually make use of this sagacious scale in various business decisions?
Case Studies
Nitin speaking First of all, I would like to thank Harsha for wonderfully explaining the backend methodology. This is How scale is basically generated, and I hope audience is now clear.
I will be discussing some of the use cases, which are, as follows, strategic planning to decide the future roadmap, collaboration decisons to become seasoned player in a particular technology domain, identifying buyer for the intellectual property or patents, for that matter, strategic acquisition targets, and monetization opportunities. So, I will be talking about these five use cases and let us discuss them when we won in the upcoming states.
Strategy planning to Roadmap.
So as we knew that, irrespective of any company, or what is the position of that company, a big company would like to become a season player in this technologic domain. So, even if you are an entrant, , you would definitely would want to become a seasoned player. But how will you do that?
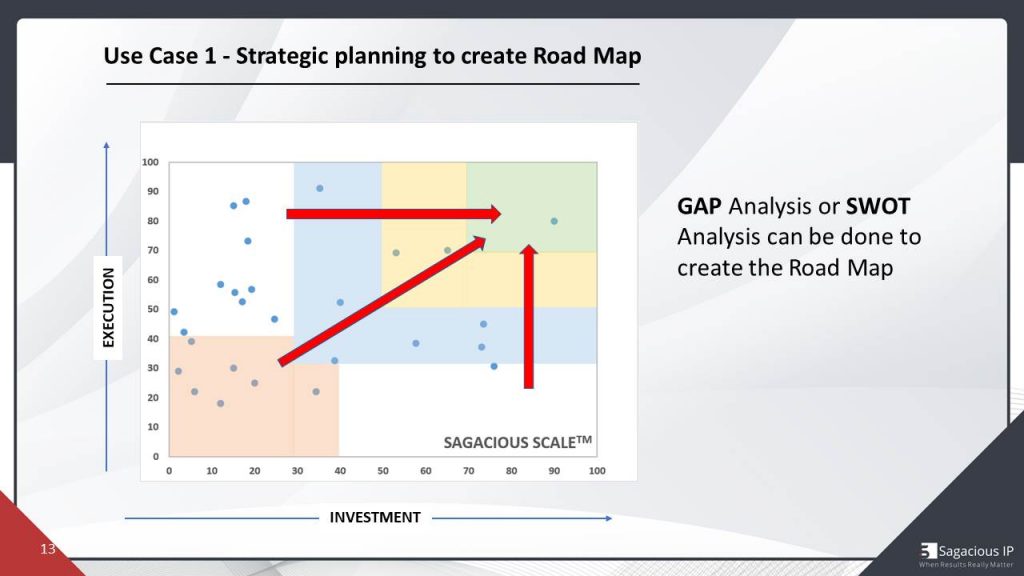
So this is the application area of the Sagacious Scale, that, basically, you can do some kind of gap analysis or spot analysis, and you can decide the future roadmap to become a seasoned player.
And let us try to understand the example of drone industry again, so I have considered two companies DJI, that you can see is that right? Top of the things, that means it is a seasoned player, it has done fairly well.Both on investment axis, as well as execution axis, And another company I am taking is MATTERNET, which is entering as aspirant. So, how it can basically become a season player.
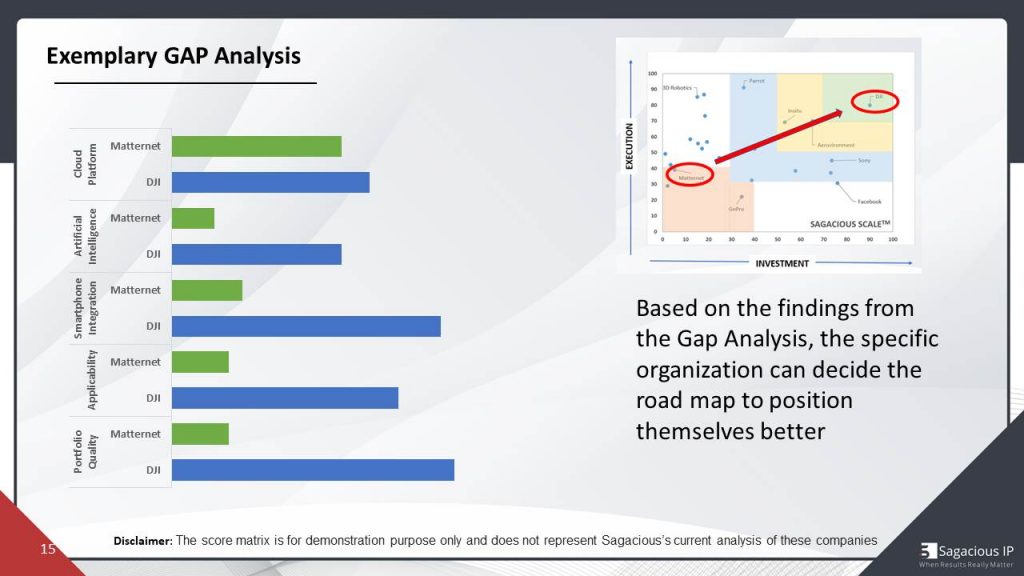
So, for that, it gap analysis can be done and how we will be doing that. We know that sagacious scale is basically a function of various investment parameters and execution parameters, although multiple parameters are there. I have taken some of the parameters to show. The gap analysis, how it is done and how it can be utilized to decide the future state.
So here we are, I have taken some of the investment parameters and execution parameters. So as you can see on the Cloud Platform, I have compared Matternet & DJ. You can see that if we talk about the technology domain , Matternet has done fairly good and it is almost as good as DJI. But in case I talk about maybe last parameter portfolio quality. DJI is far ahead from Matternet.
So, by looking the difference or gap on various parameters, MATTERNET can basically decide where I am lacking, and what should I do to fill up this gap and become seasoned within this domain.
Collaborations to Become Seasoned player
So, here basically we are trying to identify that how the companies can basically join hands to become seasoned. Companies which are at right bottom site, whose investment score is very high and the companies which are on top left side, whose execution score is very high.
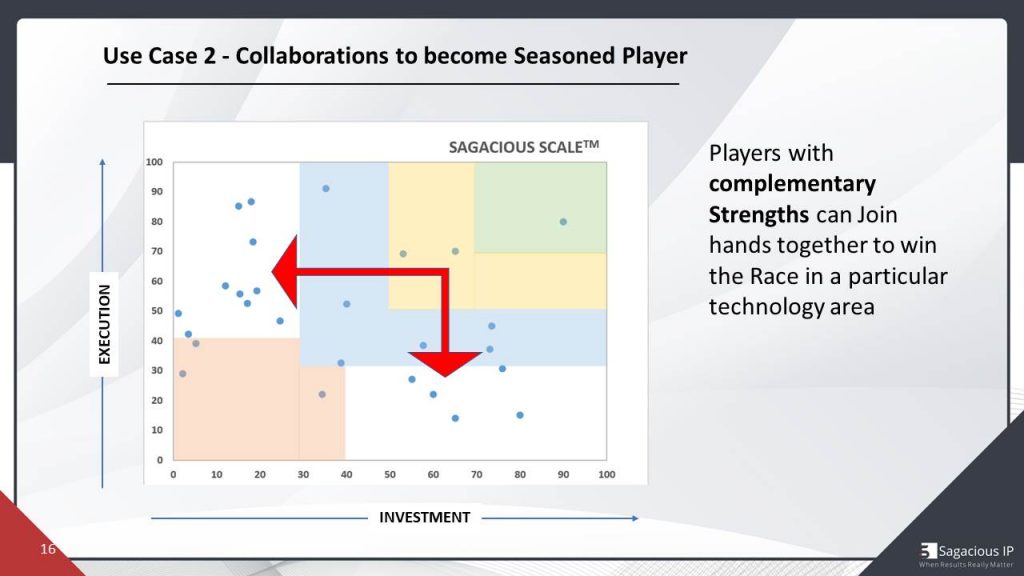
So, of course, the obvious choice is that is companies of these two grids join hands together.Then obviously, they can become season player. let us, again, try to understand it from drones industry perspective on it.
So, here I would like to explain this slide, by the perspective of Facebook. Facebook, as you can see, is on the right bottom side of this graphical representation, that means its investment score is really good.
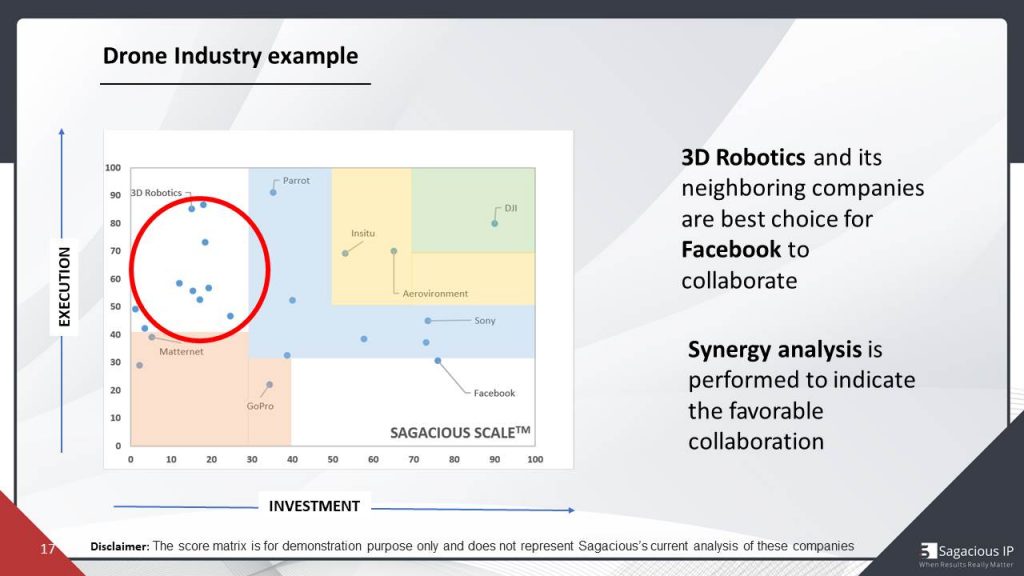
Facebook would like to collaborate or join hands with some company, who’s execution, score is high.That’s all synergy, what we did. Win-win situation would be there for both the companies. basically, you can see, adjacent or neighboring companies are the obvious choice for Facebook, so that it can collaborate with them and basically try to become season. So, this is one of the observations that can be generated from the Sagacious Scale at high level.
Synergy Analysis
No, we know that these 7 or 8 companies are relevant for Facebook, but out of the 7 or 8, which can be the best match for Facebook? For that, we provide some type of analysis, which is called Synergy Analysis, so we see whose, what will be the best combination of Facebook and another company.
Again, I will be taking very few parameters, not all the parameters, because I just wanted to show the intent of it. So here we have synergy analysis.
Here you can see that I have put Robotics company. II have put some of the parameters. How is the product majority ,durability, hows the manufacturing capability of a company?
Always geographical presence, sales are good or not, vision of both the companies is aligned or not. So, depending upon these parameters and many other parameters, Facebook can see that what exactly they are looking for a collaborating partner.
So, maybe Vision of 3D Robotics as you can see is not matching with Facebook. We have provided Red clip for that, but, maybe, if be referred to as adjacent companies vision alignment is there.
So, that means other adjacent can be the best match for Facebook and if these two companies combine, then that can be institution for both and the combined collaboration party can become seasoned player..
Strategic Acquisition Targets
As we know, many of the companies found to become season player by acquiring other small companies or entrance. So, as companies are generally looking for acquiring entrance. Obviously, this is the great representation, which is the obvious choice for acquisition.
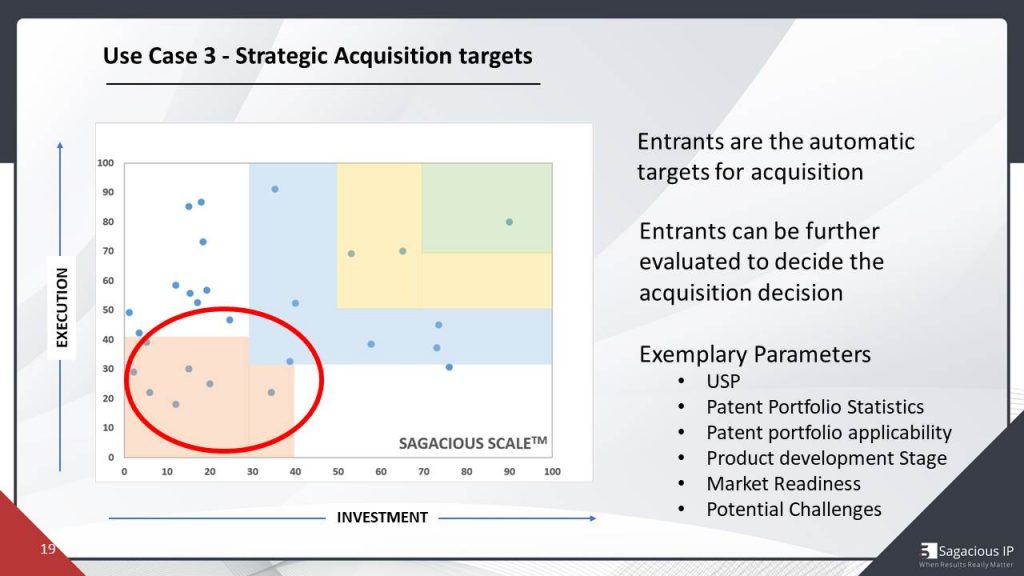
So, again, 8 to 10 choices are there for any company to acquire and which one to acquire can, again, be for the decided by further analysis on various parameter.
For example, I showed a single analysis in the previous slide, similar can be done on these parameters, about the USP of that startup, patent portfolio statistics, its applicability ,is product is ready or not. Are they facing any potential challenges? And if yes, how they are addressing those challenges. So, this type of analysis can be done.
And then the best decision can be taken based on the best synergy and keeping in mind the vision of the company, which is looking forward to it, way to go. So, again, it is another interesting use case of this topic of the presentation and I am moving ahead now.
Identifying buyers for the intellectual property.
So, now the situation is that suppose there is an entity or a person who has 3 to 4 patents in the domain of drones or new or in any technology and he’s looking to sell his patent portfolio
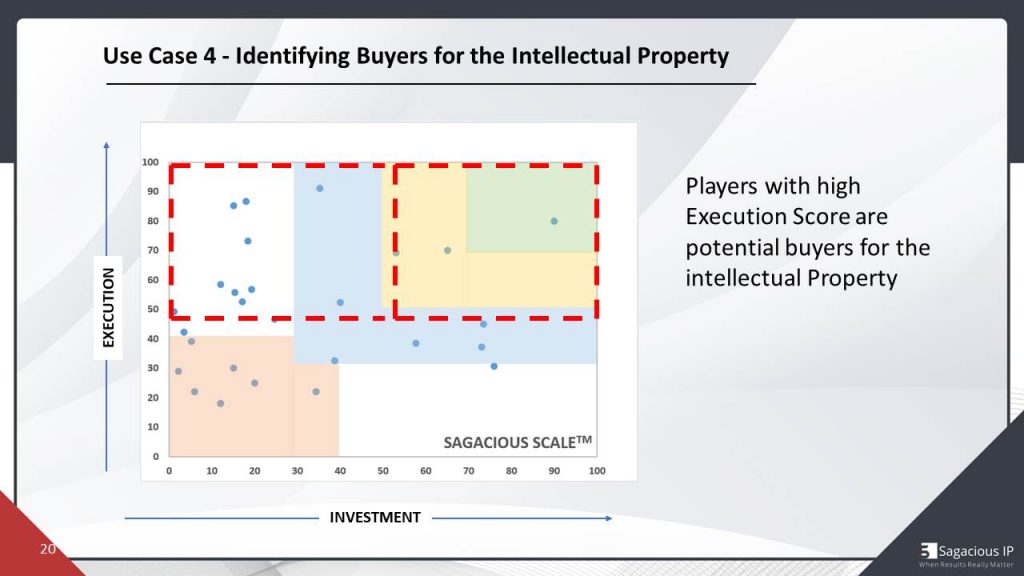
So obviously the first choice would be those companies which are good at execution side, but whose score is not big on investments.That means companies have done very practically, but their patent size is less. And they would definitely would want to protect the product by increasing the patent portfolio and they would like to increase the opinions.
So this is the grid, which is the automatic choice for selling your intellectual property or in other words, these players would like to buy a patent and increase their investment position in this graphic interface.
Then, again, there are chances that the other companies which are basically, currently leaders in this technology domain can still be interested, because they want to retain their position as leaders.
So, in case the intellectual property is good, subject matter is in agreement with their vision of the company and the strategy, then they can be automatic buyers for their intellectual property, isn’t it?
So, this type of analysis, again, can be done.
Monetization opportunities.
So when I say monetization opportunities, as you will see that, on right bottom side of this scale, there are companies whose investment score is very high. That means their patents strength, quality of the patent portfolio is really good And there might be chances that they would like to earn money, or they want to monetize the patent portfolio.
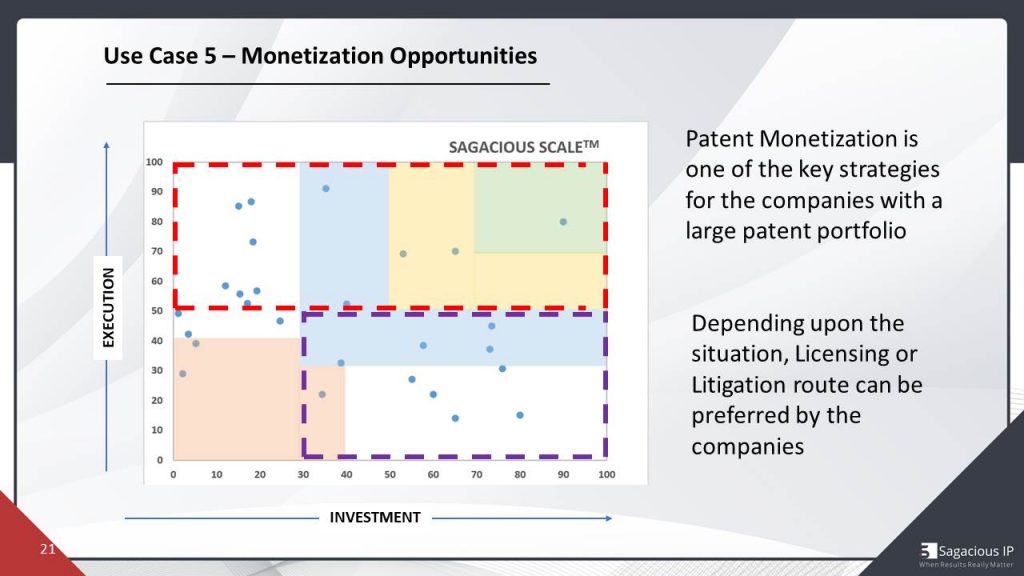
So, because these companies are looking for the potential infringers, who can basically would like to license their patents. So, again, all those companies whose execution score is very high, that means the product maturity is really good. Their sales are good, because all execution parameters are related to practical achievements only.
So these can be or automatic targets from monetization point of view. I will not be going deep into monetization because this is a very big topic and again, it can take one hour to capture it in detail. So depending upon the situation, maybe companies can dig licensing or litigation.
Quick Summary
So that’s all the use cases. And I quickly summarize before I hand over to the Faiz.So, in today’s webinar, we learned about Sagacious Scale.
- We learned that there is investment axis and execution axis and many such parameters
- Investment is heavily loaded on intellectual property or patents and then sagacious scale divides players in such a way that they can be either season fierce competitors, aspirants or entrance.
- Then we also discussed some of the use cases today.
- First use case was strategic future planning B Then we talked about the gap analysis, you will might be remembering comparison of Matternet with DJI in that particular use case.
- Then we talked about potential collaboration partners ON Synergy Matrix.
- We’re, again, we took the example of industry and we basically try to identify, which can be the best collaboration partner for Facebook, depending upon the synergy analysis.
- We also discussed strategic acquisition targets, who can be the players?
- Who it can be acquired by the companies and how they can do that.
- We also talked about, in case someone is looking for buyers, for their intellectual property so how they can be, such observations can also be made from the sagacious scale .
- We also quickly talked about monetization opportunities.
So, yes, that’s all from my side, Faiz, over to you.
QnA Session
Faiz Wahid speaking Hey, thanks.I think both of you had covered a lot of ground in a very short time, and the presentation was very succinct and easy to understand.
I see some questions also flowing in, so, you both have actually excited the participants to share their questions. Thanks for that. Let me start with the first question. This is for, I think, Harsha, although I already sort of us this initially.
Question 1. About the Sagacious scale tool and its applicability to multiple domains and industry, but this particular question is asking whether something like this is possible in the pharmaceutical industry. So, what’s your view on that?
Harsha Agrawal speaking Yeah, so, like, if there’s, as you mentioned in the very beginning, we discussed that key laser technology and thinking. So, we took an example of the drone industry, but then sagacious scale is a tool that can be applicable to any industry. While it has varied applicability in terms of getting very actionable insights we would for any technology or industries that are upcoming or any disruptive technology in an existing industry, any niche.
So, this whole idea and applying it to the pharmaceutical industry, pharmaceutical industry in itself is huge. Saying, I’ll be performing scale on the pharmaceutical industry, and then again, you’d have to identify what kind of technology specific niche industry that we’re talking about, so, say, somebody in the pharmaceutical industry or compact player, who wants to understand some specific technology in the bio- Technology domain or biopharma say, example antibody platform. that something that comes to my mind right now, can definitely use Sagacious scale to understand, which are the companies, that long standing companies that are doing things doing performing activities in this domain and, again, identify various new entrants in the domain.
So, I think in terms of its applicability to industries like pharma, we can identify those upcoming emerging technologies or niche industries, and definitely, you scale out to, again, real actionable insights that can be used for these business decisions. I hope that answers the question.
Question2. Right. And how do you really go about identifying the parameters for the model ? Like, does those, those parameters change for each of the industry, or is it just tied to particular parameters are same, and they can be applied to any industry, or for an industry would change certain parameters?
Harsha speaking So, I would, I would see that these dynamic next scale, maybe less customizable as possible. So I say customizeable both in terms of industry and both in terms of what the output is, you want it from the overall analysis.
So in terms of industry, of course the parameters of what both status, some stay the same. for example, when we talk about investment and execution, there are certain based parameter it goes that would stay the same value. In terms of investment, quality of our portfolio, by size of a portfolio would stay the same parameter, Again, products and the majority would stay the same, But depending on the industry, there can be various different parameters or can be introduced or customized. So, in the pharmaceutical industry week that the technologies, again, very specific, and there can be various factors, like say something that comes to my mind would be no. Pharmaceutical industry has very stringent parameters in terms of approval, so that can be a very good factor that can, you know, help give a show of any actual picture.
So that way, that can be customized in terms of industry. And also, in terms of what questions we are trying to answer. If somebody’s looking for acquisition targets, maybe the parameters can be more made more relevant in terms of answering that question. And so, all in all, I would say, Yes. The optional customization is limitless in terms of scale.
Nitin speaking I would also like to add here, too. I would like to give an example for the better context. So suppose we talked about the drones industry So drone industry is kind of a booming industry. You know, and many of the players are already selling phones, and they are making money out of it.
So of course the parameters like sales, market, share, etcetera, can be considered, but now let us say some type of technology, which is still not matured enough.
So now I am talking about driverless cars, and I am talking about Level five Driverless Cars in the, in that particular technology domain. None of the players have been able to sell a single car till date.
So, automatically sales won’t be there. But then, at birth level, the prototype is operational, Maybe Google has already run 1lac kilometer, by the table has got. However, Honda, , like any other company, might win initial prototype stage only. So, then, according to the Nature, we have a pool of parameters.
And, depending upon the technology, we choose those parameters which are best suited for that particular industry. So, I hope It was good.
Faiz Wahid speaking Right, so, I see also, you know, your answers are generating what questions. So, I will skip the ones on the use case part right now, and move on to some of the questions that have come in, particularly on the on the methodology part.
Question 3. So, there’s a question from Alexander about how you get data for your analysis on investment in particular technology by You know, that particular technology, for example, as in the case of Matternett versus DJI. So, basically, the question is, how do you get the data for your analysis? You know, what kind of data sources do you access, and how do you really invest identify the IP investment of the company?
Nitin speaking Yes, So, I think in terms of investment, again, it will depend on what they’re looking at. So if you’re specifically looking at, see, what kind of like a monetary investment difficult about that, so then we can. If it’s a startup weekend, we check. The funding rounds at the startup has been a part of what kind of investments have come through? And if it’s already season that led an annual reports, can be of any useful resource. And again, also, there are paid resources, which have various company data, and so we want to use a combination of both are, like, very publicly available, every data.
So based on such all those resources, we gotta get that data in terms of the parameter that I spoke about, was monetary investment. But then, again, if we’re talking about the patent related data, then we have a very extensive pool of databases update into our databases and our own analysis.
In house developer tools that we databases that we have differing analyzing based on various different data will be used, a lot of, like, a combination of all of these things to basically, I hope that answers alexander’s question.
Question 3. Right, right, and I think then, as well as your presentation, you also talked about the, you know, the evaluation of patent quality or quality of the patent portfolio. And this question is from lavanya, and it’s about how do you evaluate the quality strength of the patent and not by quantity? So, how do you really measure the quality of the pack focus?
Nitin speaking So, basically, over the years, we have been assisting our clients in doing these type of projects, , we have a complete methodology for that, and I will explain it quickly. And I will also increase that. We had a webinar exactly on this topic, and we would suggest audience to see that webinar on How to identify quality patents?
But, for now, I will see that I will say that we take around 14 to 15 various parameters on patents, which can be used, for example, I’ll talk about some of the parameters.
So, suppose one parameter is geographical spread of a company. So, say if a patent is file in how many countries, that patent is being file, you find entities, they can get patents to 10 or 15 jurisdiction. That means they are quite serious about their innovation. Similarly, you can see the count of forward citations.
So in case many organizations are basically citing your patent and based on your R&D, they are doing further, R&D, that means that patent has a very good quality and because to do, the R&D is being directed like that.
Similarly, there are other parameters, as well, for example, in how many different industries that patent is applicable, patents are written in such a way, that sometimes creating the gleam of creativity so broad that it can be applied to multiple industries. So, these are some of the parameters I talked about, but in case further information is required, we can share the link of the webinar recording.
I hope that answers that.
Question 4. , do you publish it periodically or can it be customized and how customizable it is, and also a related question is whether this tool is licensed outside sagacious?.
Is the technology mapping that has shown is it manually done or is it you know based on some AI, et cetera. So, basically what is the base of this report? and does Sagacious publish this periodically and how customizable is it?
Harsha speaking Yeah, so I think it’s a very detailed questions, I’d like to take it apart, so first of all, I think people are discussed in length about the customize, the ability of the So as we talked about, I guess it’s definitely customizable both on the aspects of the technology and also the parameters depending on what the desired outcome is, so if that answers the question.
we’re not publishing the reports that we are generating through these tools , We are currently doing this analysis for a plethora of industries and domain which will be, which can be provided to our customers or people interested parties on demand. So that is something we are working on for the future.
And these, again, are These reports can be used as it is, or it can be, again, customized based on what the like, the necessity or the need of the client is. So I think that would answer the question both customization, at the end, scale being, not being something, that is published article obliquely, but yes. It is accessible video art, because we are in a continuous process of performing this analysis on various industries as we see emerging trends or technologies.
Faiz Wahid speaking I think it’s a similar question, you know, that was around the pharmaceutical industry. So does the sagacious scale tool also cover oil and gas industry? And I think it should, right? Yeah, definitely. It has. I think, and also, if I made that I think are sagacious currently in the list and topics that we are forming the scale oil and something, like, niche technology from oil and gas is a part of that. And I think you have a slide on that, so maybe it’s good to put that slide on the screen, just for people to read out those, you know, that list yet. Yeah. Thank you. So, I think that that goes to the list of topics that you’re working on right now. In renewable energy, and oil and gas are both mentioned that in the list that Sagacious is working on right now.
And I think you would have narrowed down these topics into i more specific technology areas, particularly in oil and gas, etcetera. So depending on the on need, and in that particular domain, that’s where the study would be, right? Otherwise, the sector would be too big.
Harsha speaking Definitely. So I think like, some of these are well fleshed because they’ve already started working on and the other ones are, some of these are something that are in the pipeline in the future and so to decide what sector we are going to be targeting.
Faiz wahid speaking And you prioritize based on demand from the market as well?
Harsha: Definitely.
Question 5. Faiz Wahid speaking OK, so, I think we have a few more minutes. Let me ask these questions, the remaining questions, What kind of matrix you do you use, if any, to evaluate the strength of the patent portfolio of potential acquisition targets or foreign investment decisions. So basically this question is on this, on the use case that then that you talked about around the position or investment. So what kind of metrics would you use to evaluate the strength of patent portfolio of potential acquisition targets?
Harsha Speaking So, again, as I said it, our patent quality analysis or sprint analysis takes considers 10 to 15 different parameters for each entity, based on the each parameter.
Certain score can be provided, and the comparison can be two.
So, for example, there is a company, A & company B?
So maybe the count of our citation for company A be higher than the control over to the patent for company B. That means the R&D of that company is doing is more reliable. And many of the big players or entities are relying on the R&D to do further. But this is one of the parameter to answer, again, goes with my last answer only on the same lines. And what kind of matrix is being created can be quite similar to synergy matrix only. But instead of colors, we can basically provide the score or numbers.So, that indicative numbers are more reliable or more coherent for this type of use case.
So, in interest of time, we have been basically shown for all the cases and in case you were like, Yeah. So, fast. I would just like to add quickly that like for the quality, specifically for portfolio quality analysis that we do, it’s kind of a nested the process, because the patent portfolio for us, like inequality would be a meter on this axis. So, it would have an overall score, But this is, again, based on an analysis that we’ve developed in house, which is our ranking that we do as a service, where we, again, use various different parameter list of related to patent specifically, like, has mentioned, a lot of them like citation, or, you know, collaboration in terms of patrons only. And then, these companies, Like, give them these scores and ranked based on the overall score that they can get.
Question 6.Faiz Wahid speaking When you undertake such kind of a study, you know, it would involve a lot of, of course, data that is publicly available. You also talked about data that you acquired from multiple sources, etcetera. So what kind of effort and costs are involved in, such kind of analysis to, let us say, for the example that you showed the drone example, just, for a sense, for our audience, to understand, you know, what kind of effort actually goes into producing such kind of analysis?
Nitin speaking Hmm, too tricky question, I would say that it is very difficult for me to comment on the cause, But definitely, I can talk about efforts. So, depending upon the complexity of the technology, the somewhere between 70 to 120 hours are sufficient for any technology area, for doing this type of analysis. Goes with, again, always vary because, as I mentioned, in some of the parameters we have to acquire from the big data sources and when we are acquiring data, then, again, money is involved.
And, then, cost is basically variable, but, in term of effort, I get 70 to 120 hours of expertise, generally, sufficient to do this type of analysis and the technology domain, depending upon the complexity, depending upon the portfolio, size, and other vectors.
Faiz Wahid speaking Let me, let me also come back on the, on the, on the use cases that you shared.So are those the five use cases that, you know, are possible, or do you also have other use cases which you, in the interest of time, probably did not covered yet?
Nitin speaking I would say, Yes, Sagacious scale is doing that. It is putting multiple players on graphical interface. So there is a position for every player, and there is an investment school and execution support for everybody. it is up to you how we basically want to interpret that data. So, I have interpreted in five different ways, but I’m very sure that it can be at least five more use cases. I can think about 2, 3 other use cases at the present time.
For example, if I say a company wants to benchmark direction of patents only, they are only interested in IP side of it. So, we can use Investment and as harsha mentioned how to do that analysis, how many number of patents are involved to score?
I want basically the future direction of my IP portfolio. So, then sagacious scale can be used for that as well.Similarly, I would say for technology licensing, there are entrants. And some of the entrants can definitely come up with ground breaking technologies, and maybe they are not interested in, basically, been getting acquired. And they are more interested in licensing their patents. Then, again, those players can be identified, which are in the capability, who was busy, aligns with those technology area, and they would basically want to license their technology.
So these are another couple of use cases that I can think of, but in interest of time, I selected those types, which are basically quite important, and I basically prioritize them, but definitely more use cases are possible.
Question 7. Faiz Wahid speaking I think there’s one more question and this relates to the scale that you showed me, and then you can take this one. The scale that you showed the, Facebook had a very low execution score. So, the question is, How can such a big company lack on execution axis?
Nitin speaking execution score is basically as a function of various parameters that be considered. And at that point of time, when we were doing this drone analysis, I remember that Facebook was doing some kind of a project that was quite an ambitious project.
By using drones, they wanted to provide the Internet access to remote test of the places.So unfortunately, that project failed at that point of time.So Facebook couldn’t execute it well and that’s how execution score in my opinion is low, although other parameters will be involved.
But this would have been definitely very big parameter due to which execution squad of Facebook is. So although R&D efforts are very high, investment score is very high, That means Facebook was serious about that project.But unfortunately, it didn’t go well for them at that point of time.
Faiz Wahid speaking Great, great. I think that wraps up most of the questions that we got. There are still few. But I think we have already covered them in the sidelines. So, I think, let me kind of Thank in a nutshell for the, you know, the presentation, and also the answers, that both of you shared. And let me also thank the audience for, you know, finding time and staying with us now, and asking these great questions. This has been a wonderful session. We have on the slide right now, the upcoming sagacious scale topics.
I am told by the Sagacious team, that, you know, these topics are going to be published and for the participants of this particular webinar, we’re offering a discount of 50% on the reports that if you’re interested to participate and you can, you can write to us at [email protected].
So, I want to extend a big thank you to all our listeners, and you know, the speakers who helped start on time and finish in time as well, leaving five minutes for us to spare, which we can all enjoy in the evening today. So, really happy and appreciate all your contributions, participation, and engagement today.
Thank you so much, and looking forward for you to join us on our next webinar. And have a great day. Thanks a lot.
Submit Your Information to watch the Webinar Video:
"*" indicates required fields